Learning Company User Experience Research

In a learning science company, Product Developers are users just as important to me as any customer.
Product Developers contend with every new initiative in a company whose primary offering is content.
I have managed Product Development teams in multiple learning companies offering high-value learning content. The role of the Product Developer is to be responsible for the quality of the content as well as to imagine and author engaging experiences for learners. Therefore, when new requirements are set for the content or the experience, the Product Developer (or PD) must grapple with the impact. This caused paint points for my teams while the greater organization modified tools and workflows to accommodate the new product needs.
In one such instance, my company responsibly decided that our content must comply with WCAG (Web Content Accessibility Guidelines) standards, which requires that all electronic and information technology be accessible to people with disabilities, including employees and members of the public. In our case this was crucial because we curate and sell learning materials to colleges and universities that receive federal funding and therefore must provide accessible materials to their students.
It fell to the PDs to make all content accessible, including print and digital texts, interactives, assessment banks, and videos, as well as instructor-support materials such as Powerpoint slide decks. However, my team had access to only one in-house accessibility expert, who provided various training sessions and documentation on the company’s intranet site. Over time this work — though extremely worthy and desirable — had become quite taxing for PDs. It required specialized knowledge and project-management tasks that took their focus away from other primary responsibilities. My fellow Product Development Managers (PDMs) and I needed to advocate for more help and/or a better allocation of resources.
To be their advocate, I needed to learn more.
I was chosen to represent our group in a high-level, cross-department discussion about the process required for this accessibility mandate. I was concerned that I did not truly know all of the work required by my staff, so I decided to prepare for the high-level discussion by interviewing PDs. I would thus better communicate their process as well as their pain points to upper management. I hoped for an opportunity to present my own ideas for changes (and relief).
I wanted to draw a picture for my colleagues.
The best way to explain the issues was to show my colleagues a picture of the full 18-month development process for a product, and how often the complex needs of accessibility compliance touch that process. In addition, I wanted to show the pain points, such as the new expertise for which the PDs had become accountable, and the added workload required for hiring, training, scheduling and managing subject-matter experts. The best way to accomplish all of this in one straightforward infographic was to create a journey map.
I set up my protocol and conducted interviews.
Given my own knowledge of the product development process and many previous conversations with my team about accessibility requirements, I decided that interviews with four Product Developers (with varied experience) would provide enough data.
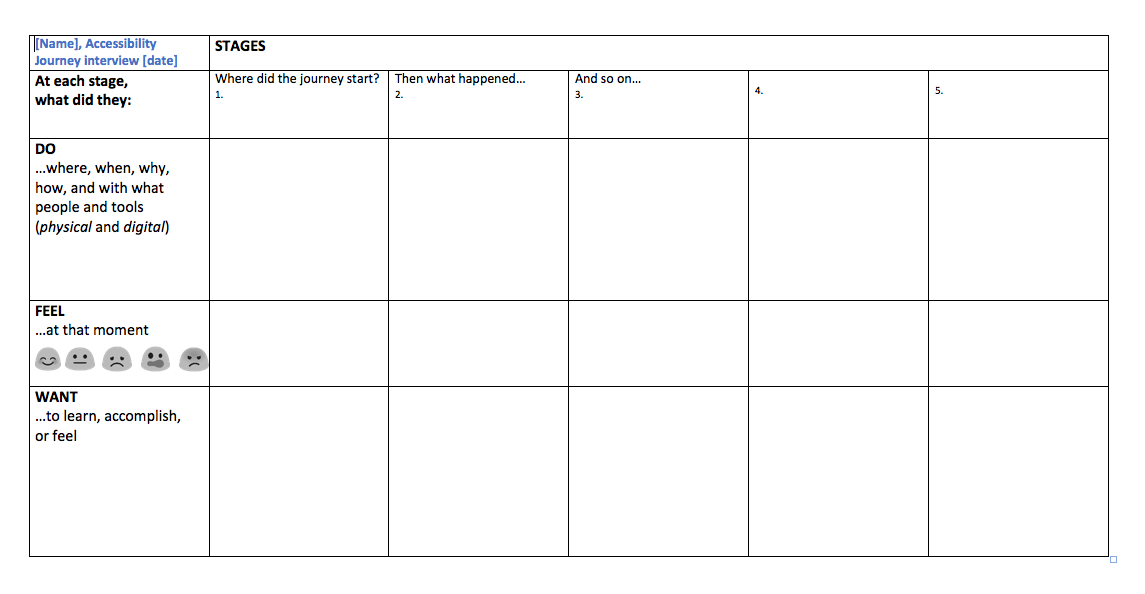
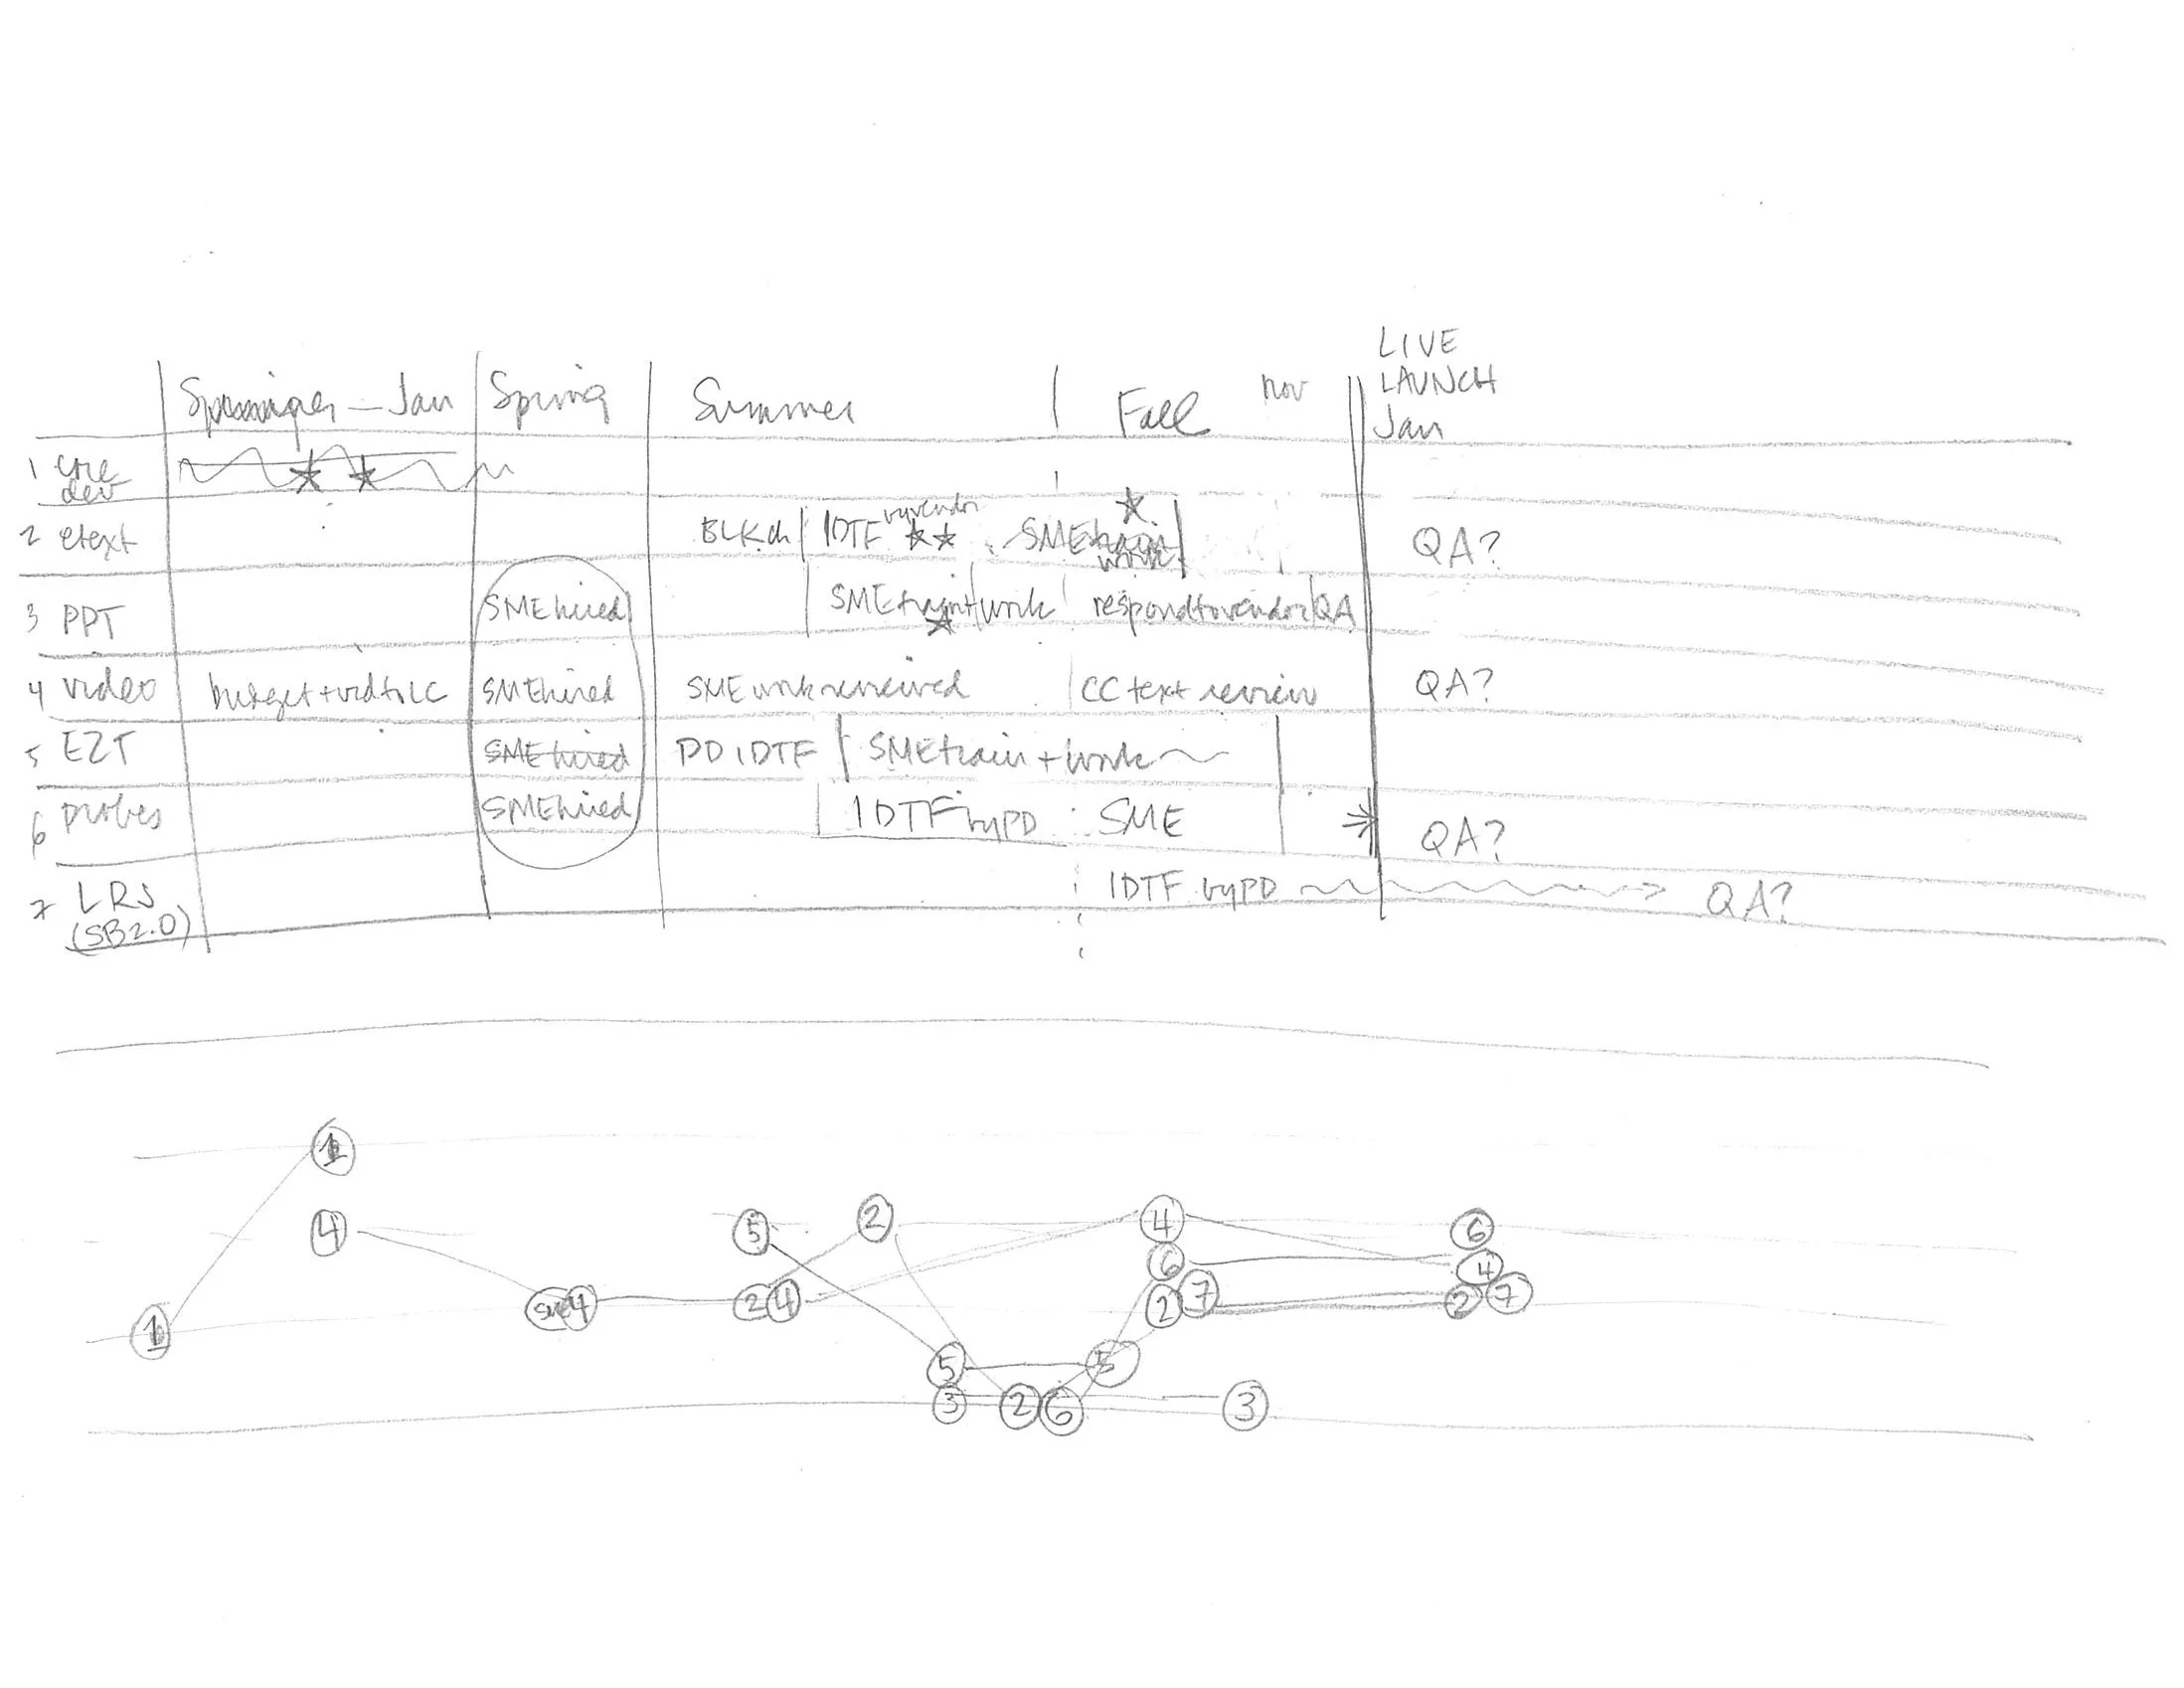
Armed with certification from the Nielsen-Norman Group journey mapping course and templates from a second journey mapping workshop*, I derived two Microsoft Word-based worksheets for my research. In 90-minute one-on-one interviews, we walked through the end-to-end process for developing and launching a product. I avoided awkwardness by explaining in advance that I simply wanted them to talk through their experiences, and I would avoid interjecting (as I would do in a normal conversation).
The first interview worksheet prompted me to ask for a description of each stage of the PD’s process and their emotional state at each accessibility touchpoint.
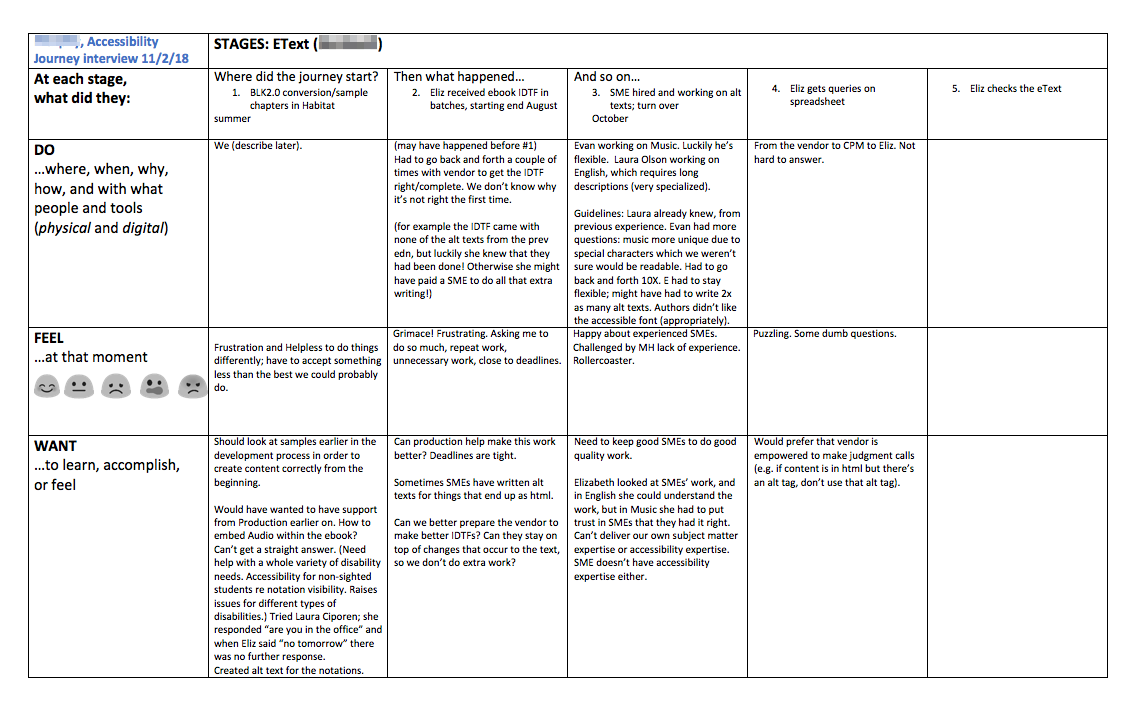
The interviews went smoothly, partly because they knew I would use the information to advocate for giving them more help. Patterns began to emerge, but I avoided the temptation to make assumptions or to ask leading questions.
There were more pain points than gain points.
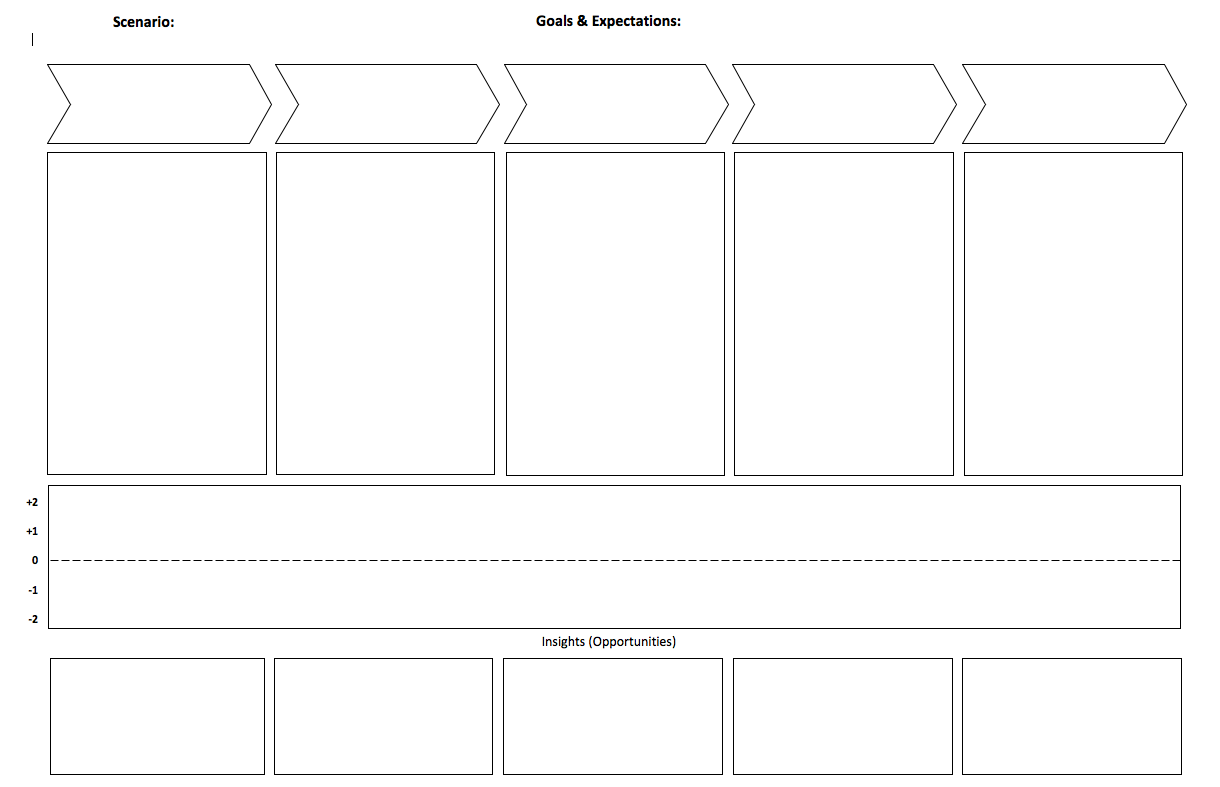
Using the second “Goals and Expectations” worksheet,* I synthesized my interview data into a single analysis and derived a few key takeaways.
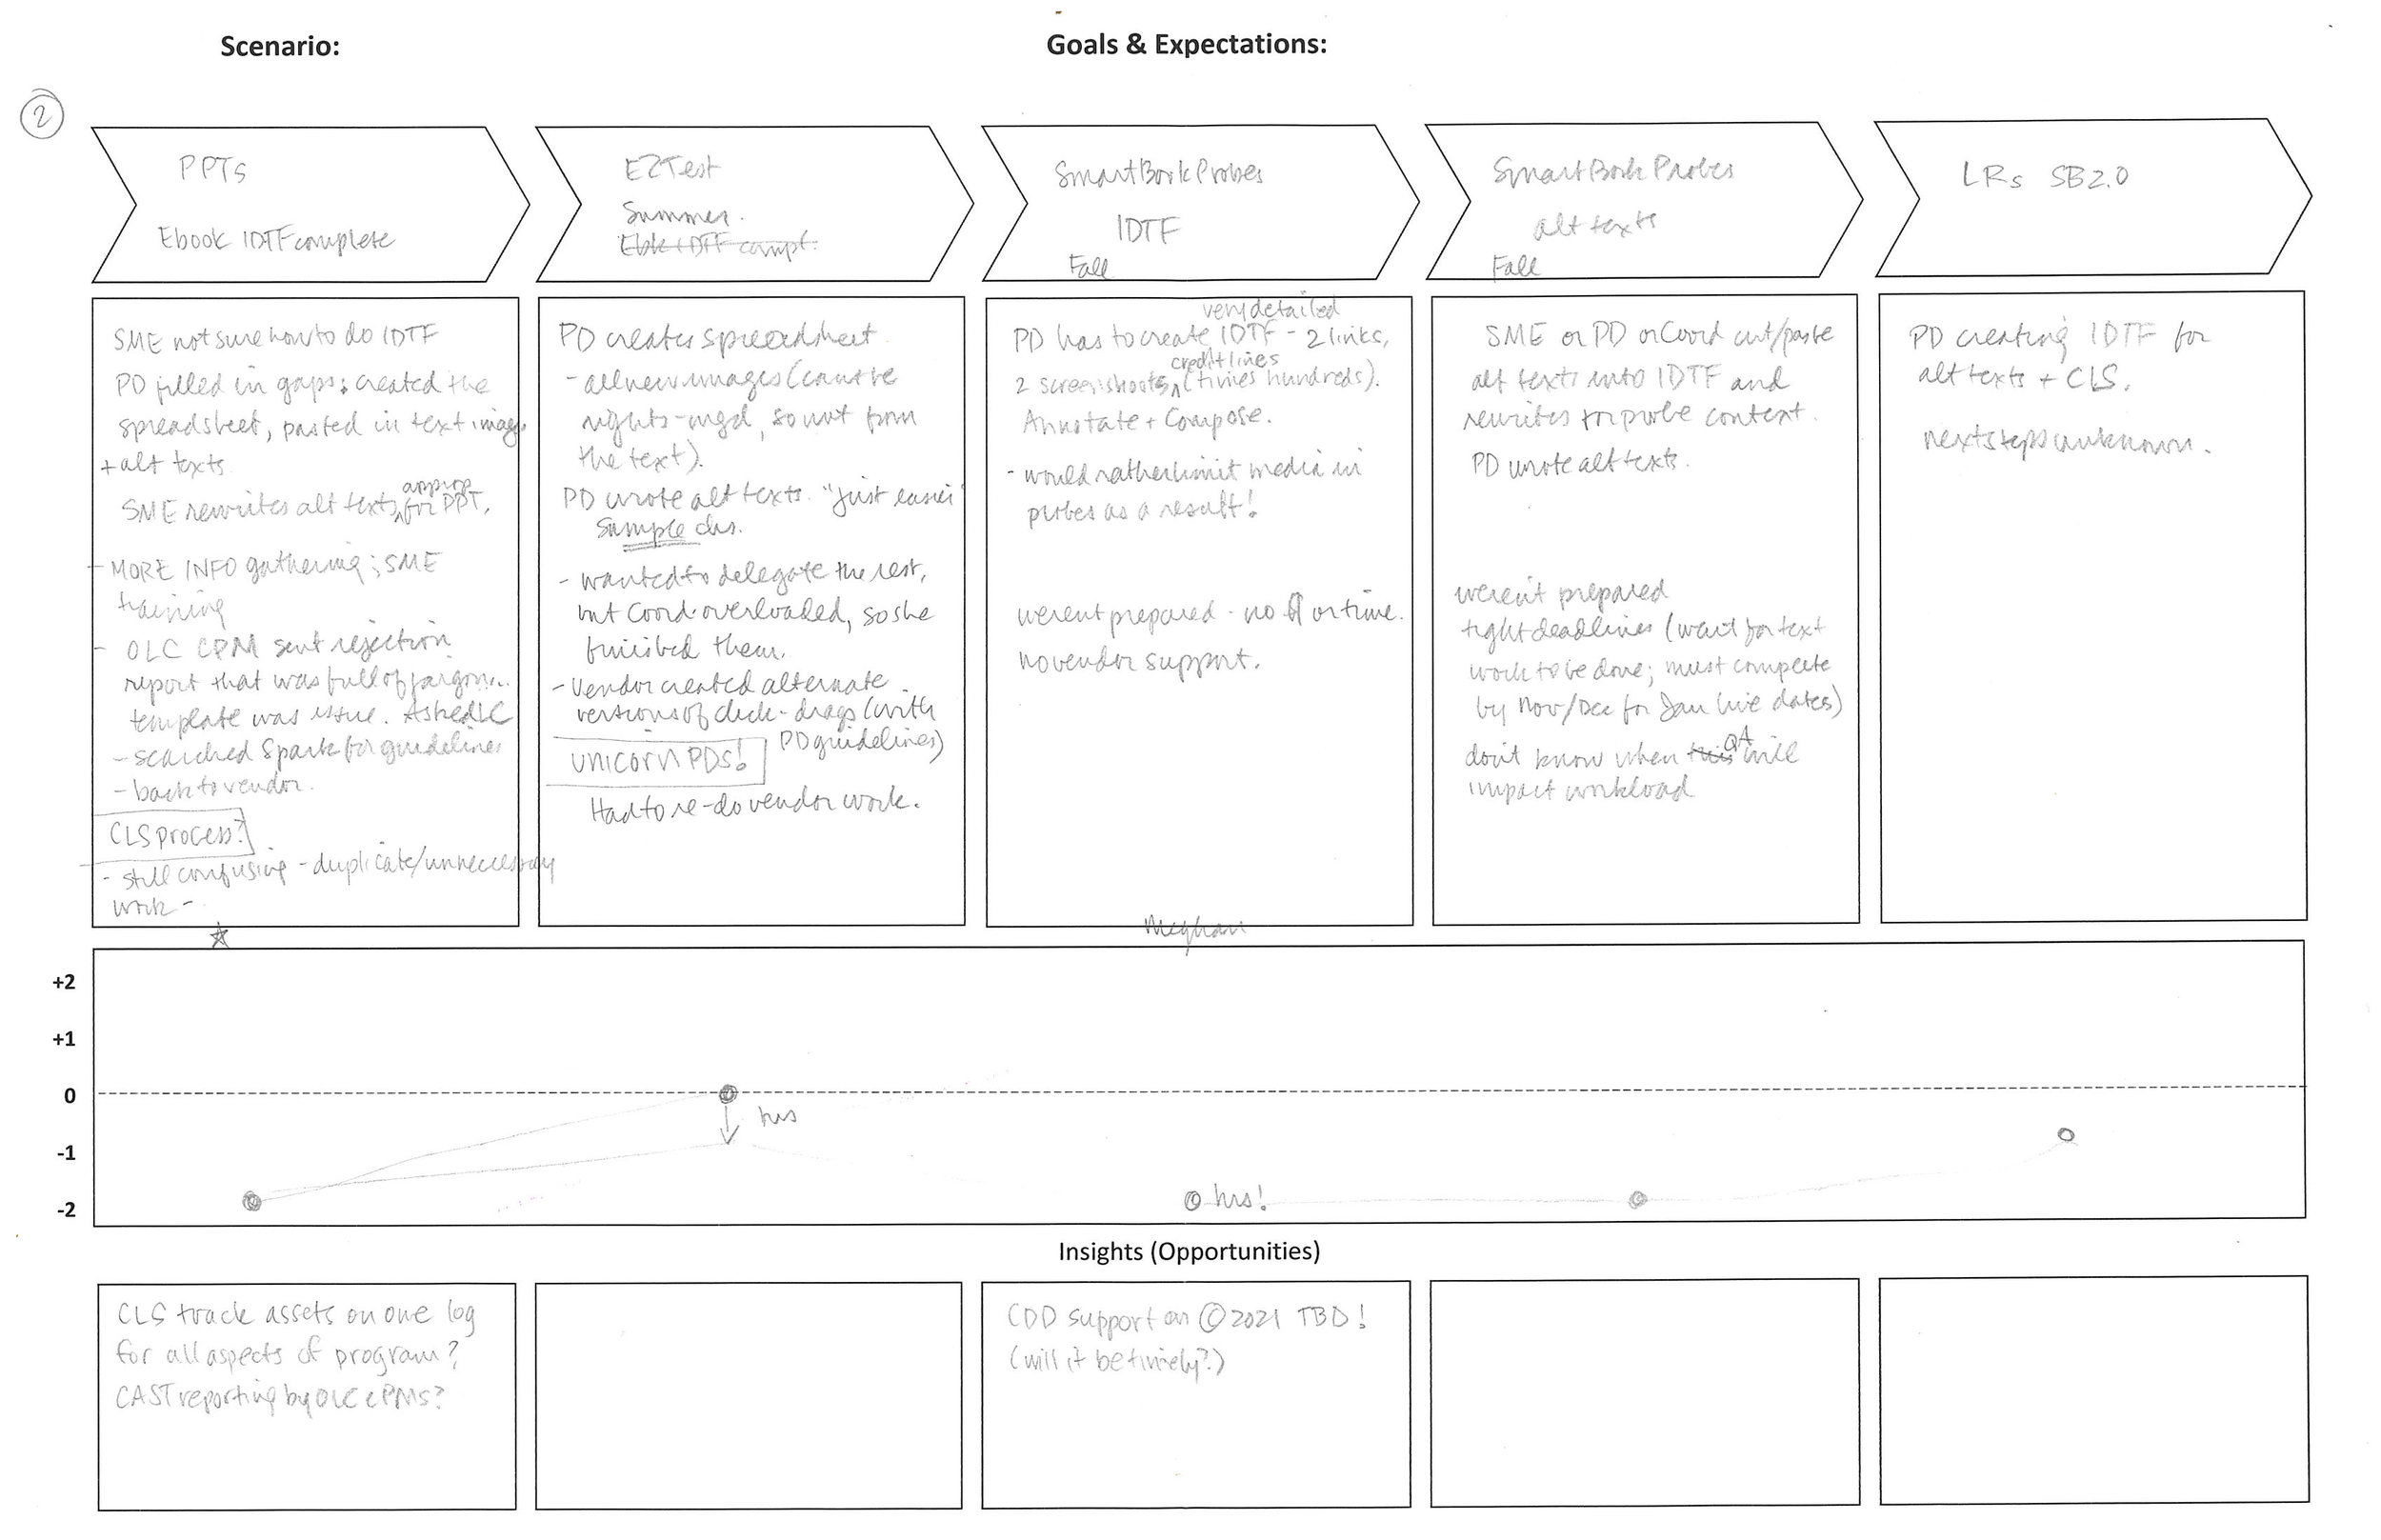
Key takeaways:
there were more pain points than “gain” points in the process of making our content accessible
my small sample of PDs contacted our single in-house expert 10 times in the 18-month process, which was not sustainable (especially when multiplied over the 60+ PDs in our organization and hundreds of products developed every year)
PDs were training different alt text description authors for every project, also unsustainable
content design issues cropped up late in the process, when there was little or no time to make fixes
These issues made it clear that workflow changes are required.
*I had additional training in a Pratt IXD journey mapping workshop conducted by Jill Fruchter, Consumer Insights Director at Blue Apron (templates shared with permission).
Key insights revealed several opportunities for workflow changes.
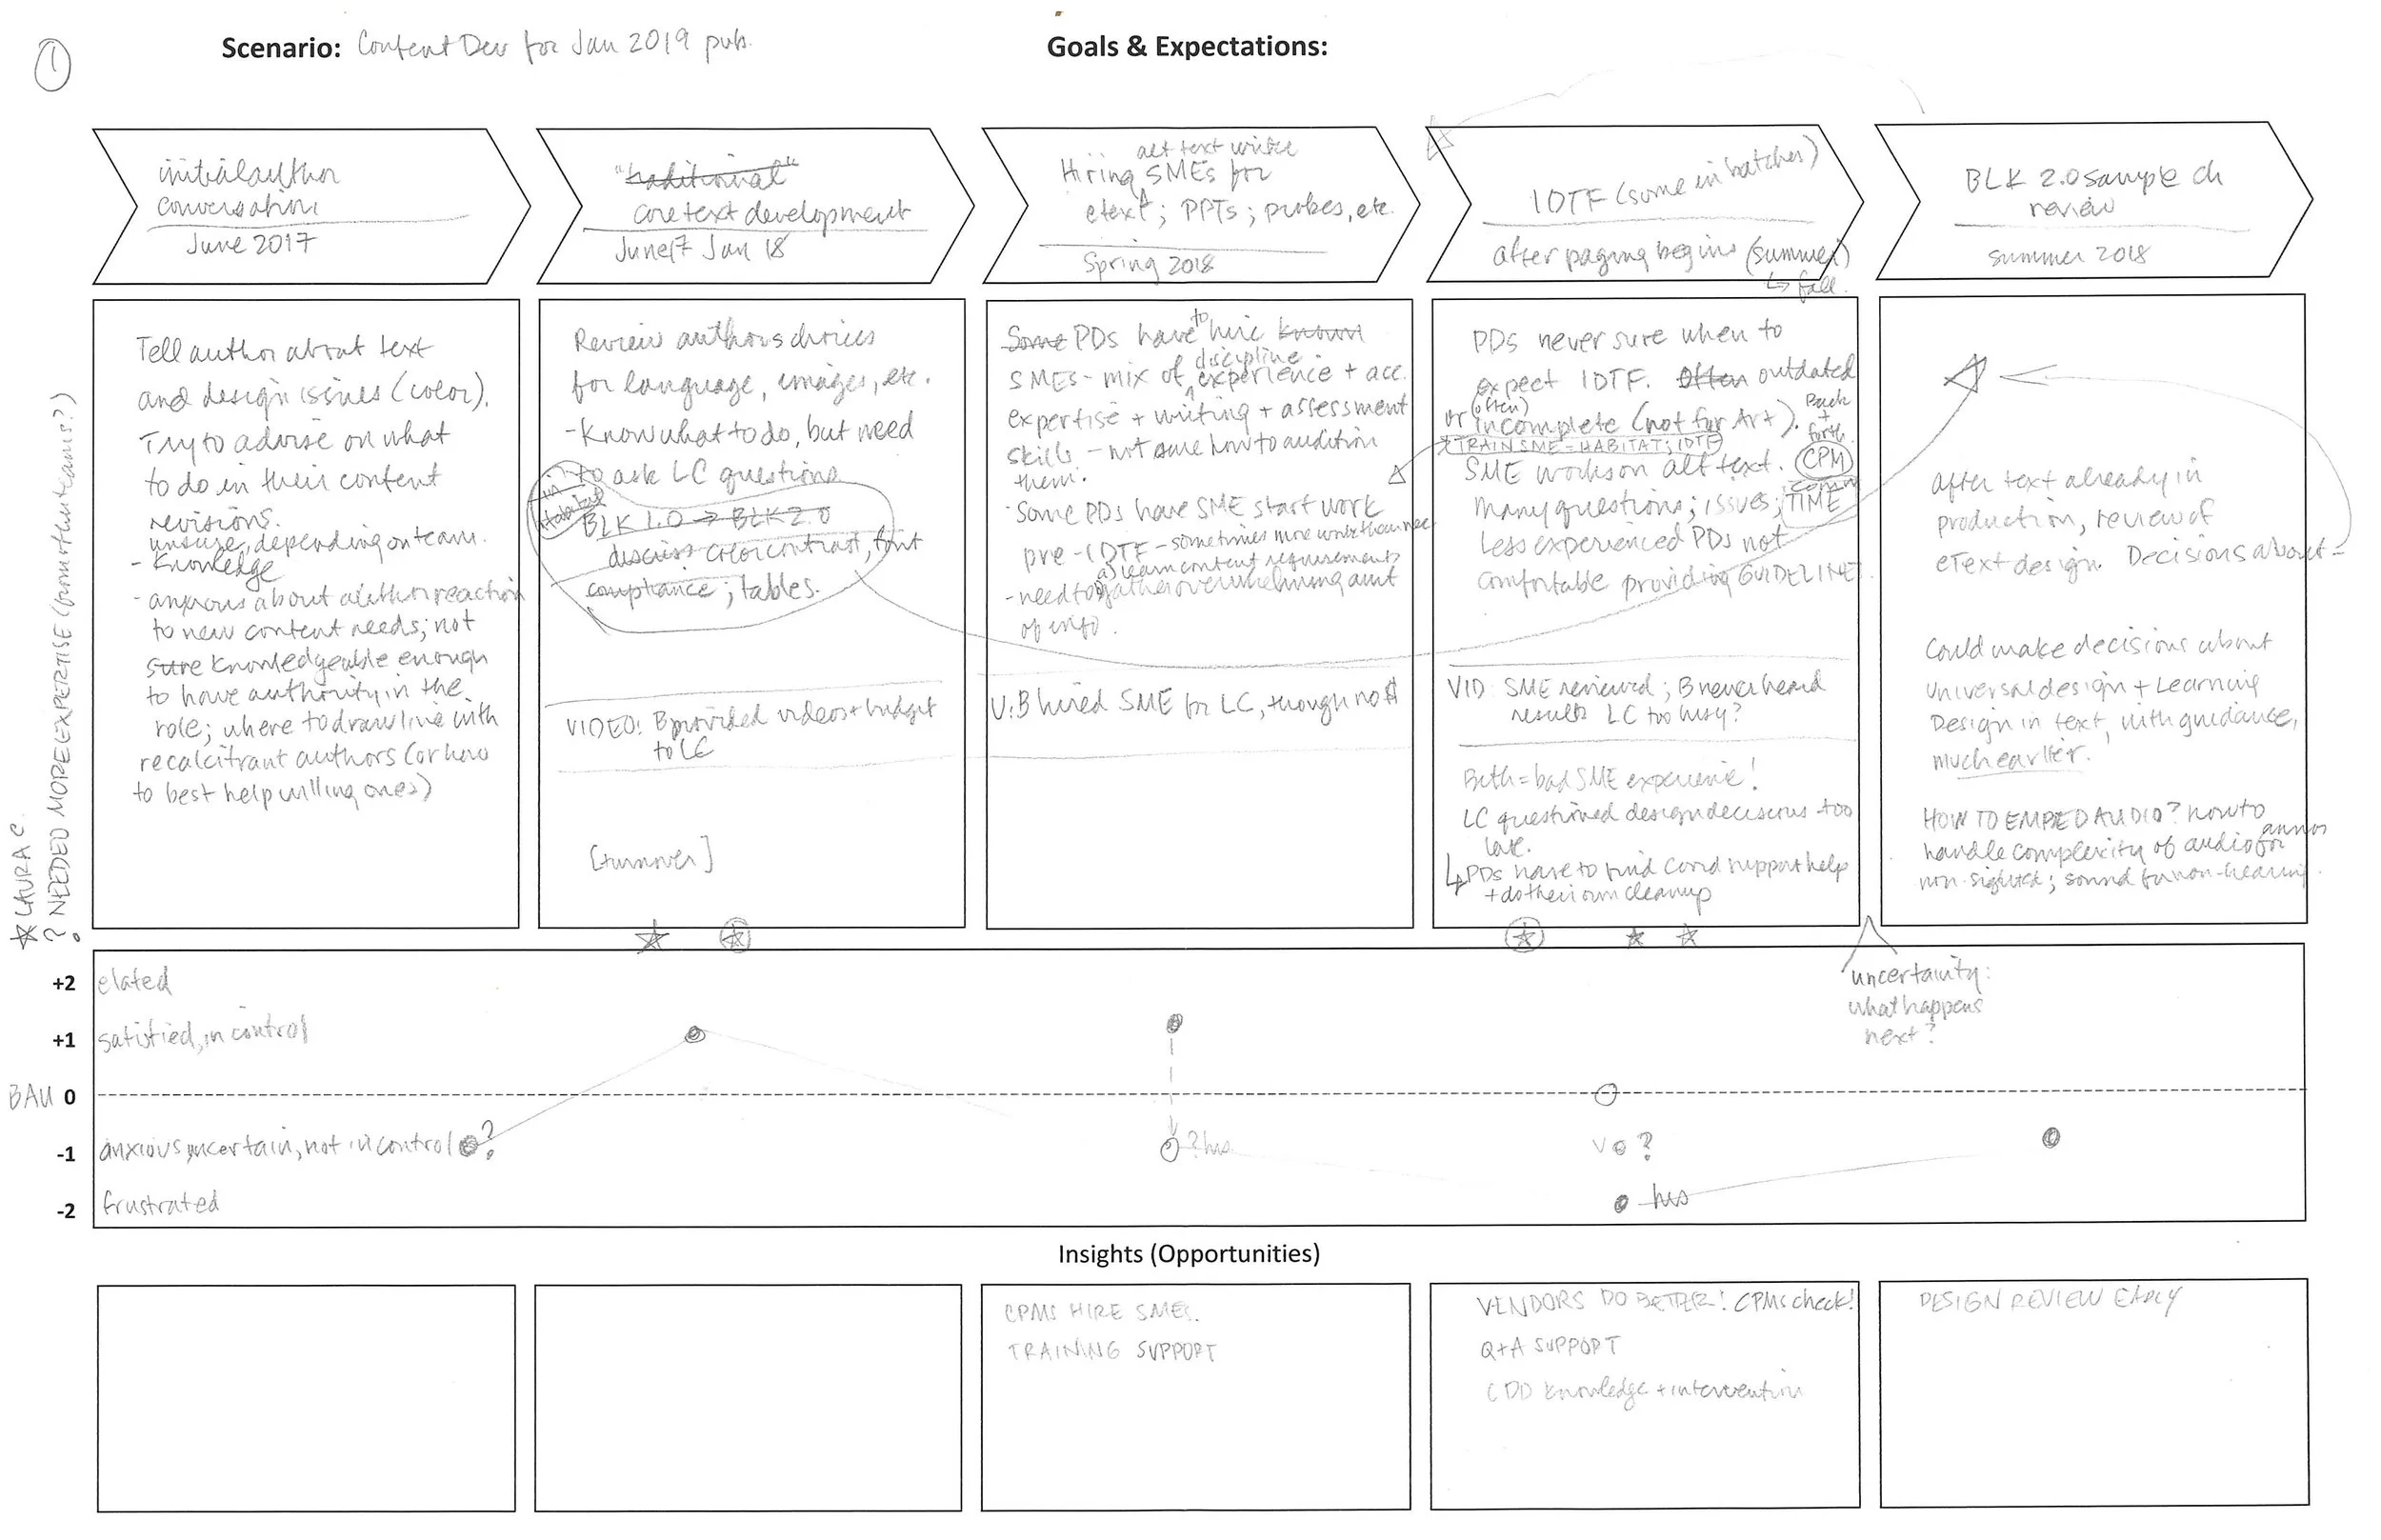
Though I am not a designer, I easily created a straightforward journey map using Miro, a free online platform. I customized my own map from a template, creating a very serviceable picture of the product development cycle (shown in the rows on the top half), the accessibility work touch points in the workflow (shown as boxed annotations in dark blue), and pain and gain points (as orange and green dots).
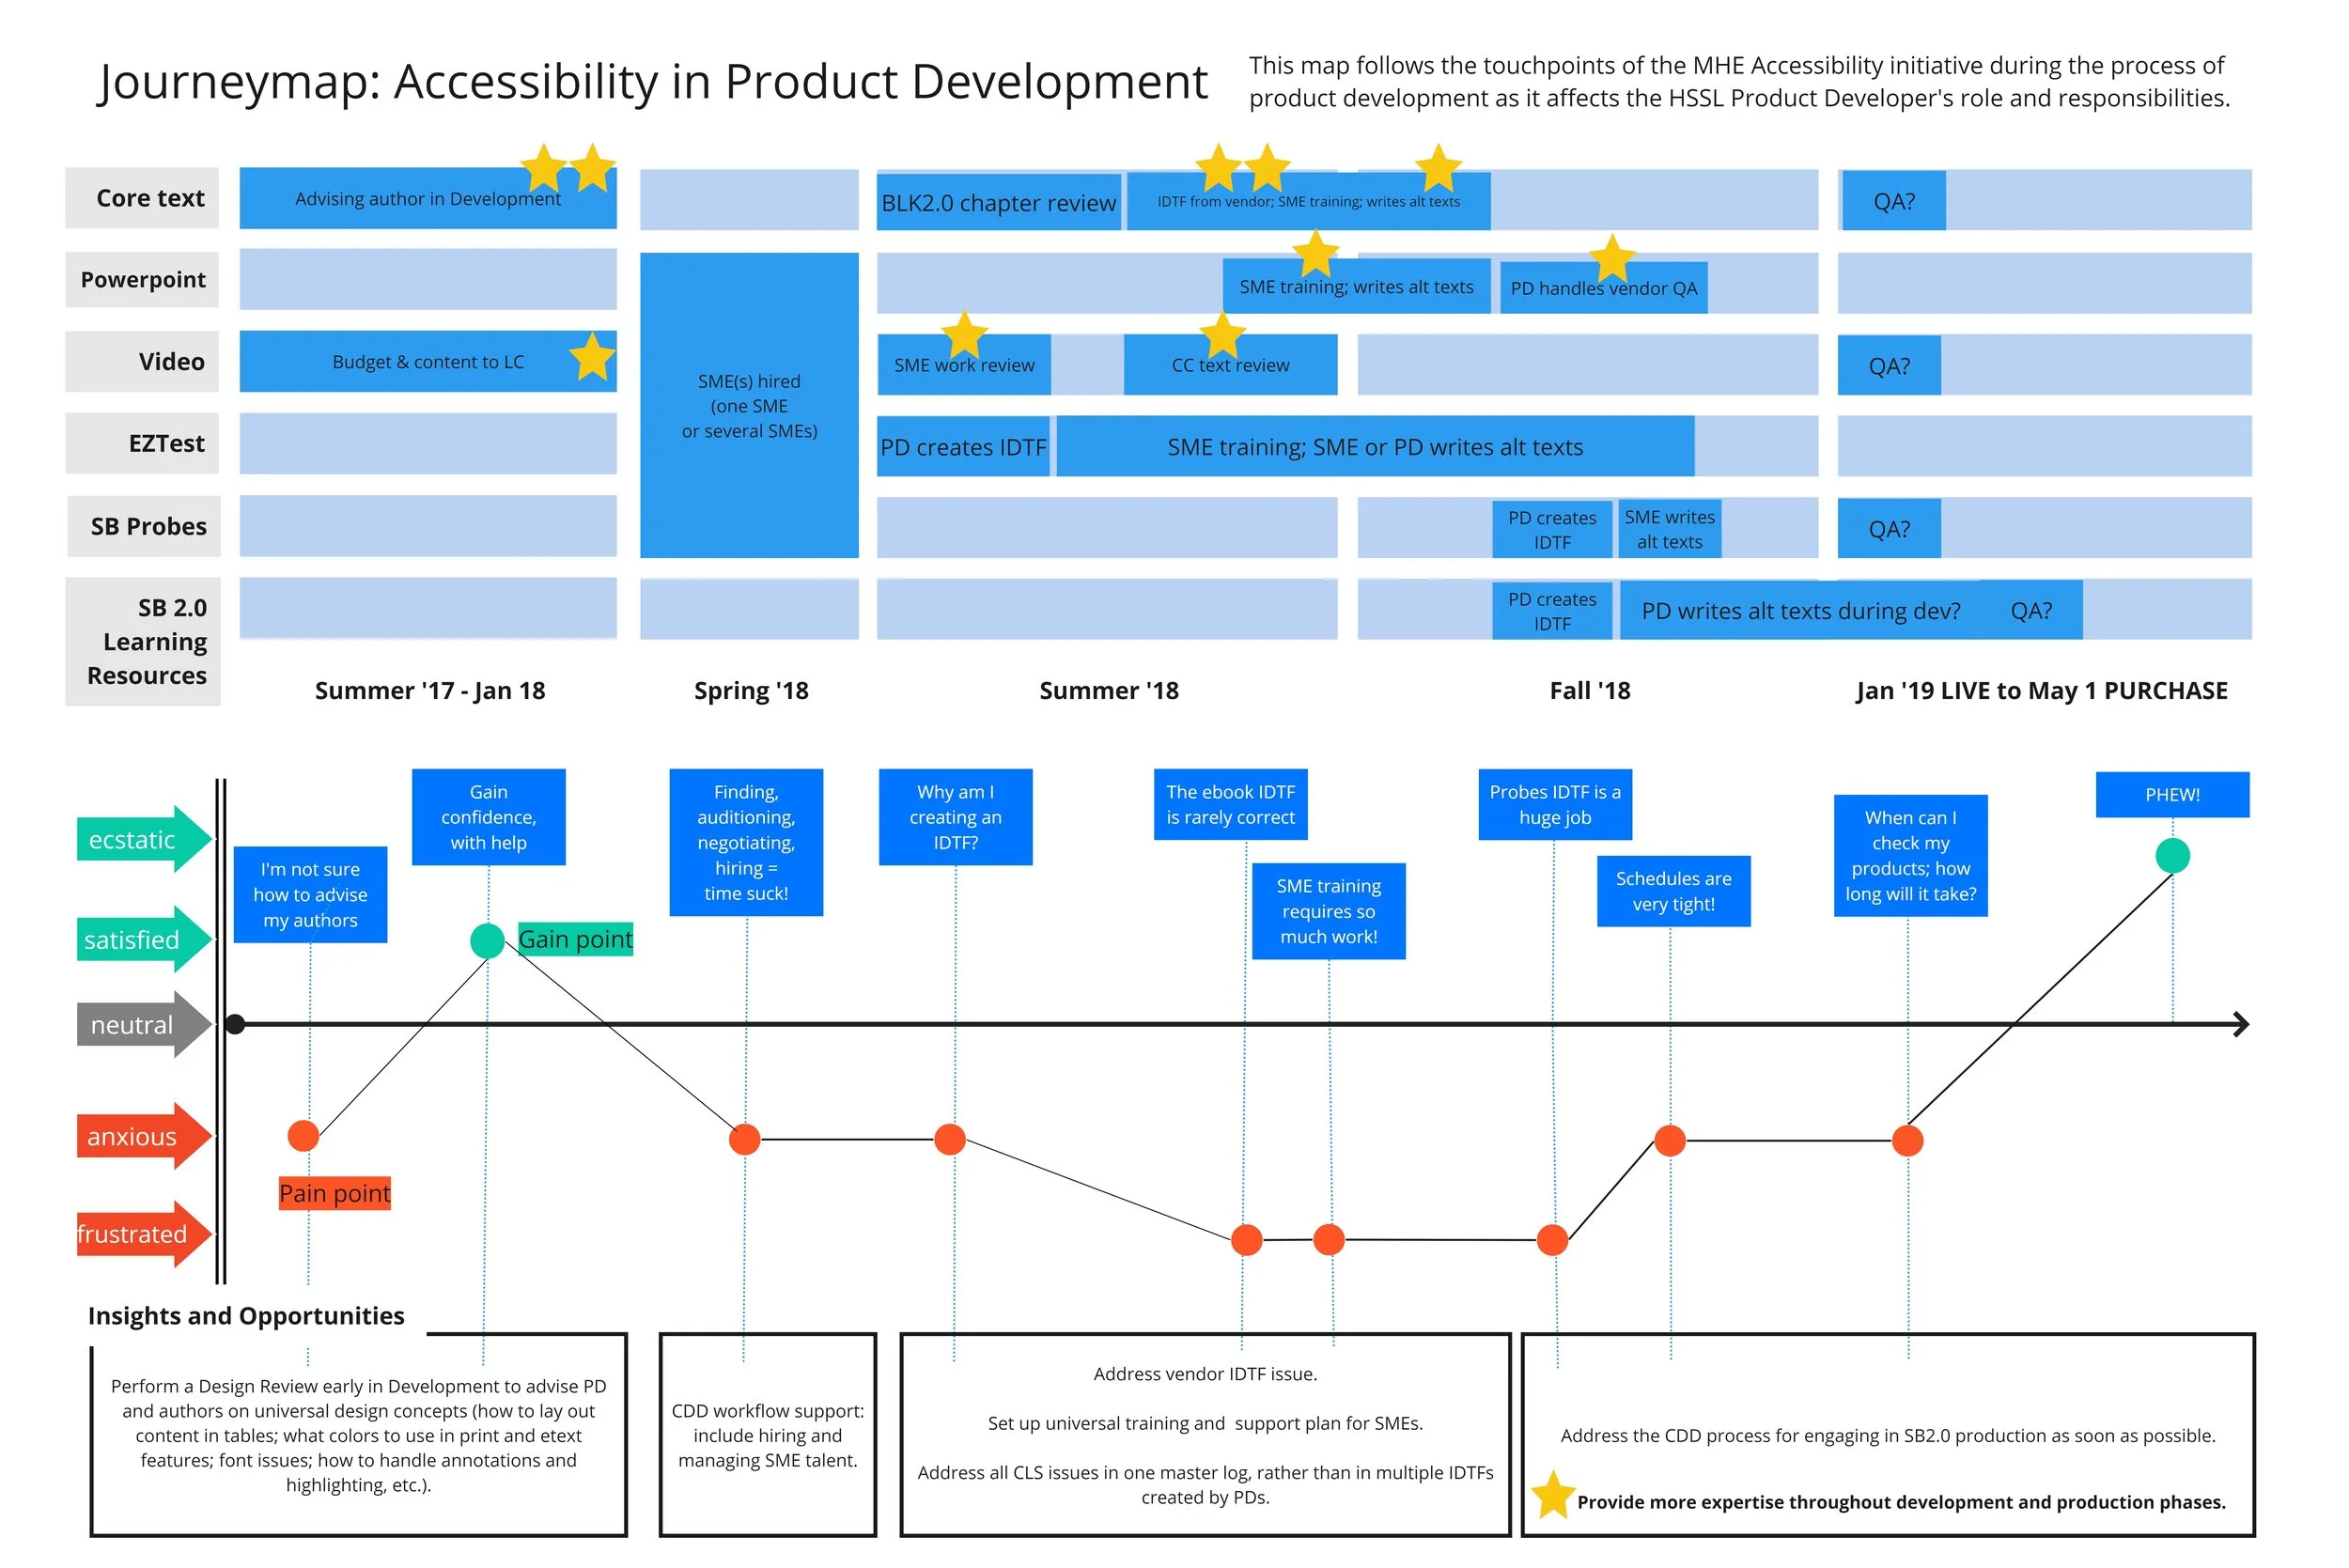
In the top section of this infographic, blue bars capture the scope of the development process for all components of a product, from its beginning in summer 2017 to commercial launch of the product in May 2019. Gold stars indicate how frequently PDs sought help from our single in-house expert. In the lower section, pain points are mapped to the accessibility touch points during the process. Along the bottom are insights from this research, and opportunities to improve the user experience of my team.
I discovered several ways to improve the user experience for my Product Developer team.
Insights and opportunities:
a well-informed design review conducted very early in the development process would solve problems that currently crop up painfully later on
we needed to enlist help with project-management from other teams in the organization
we needed to streamline the content management and creation of alt text descriptions, currently handled in multiple complex spreadsheets for each product suite
Presenting my journey map resulted in improvements for my team.
I had only 10 minutes in the high-level meeting to present the issues for my team. This artifact — which took approximately 10 hours of research, analysis and design work to create — provided a powerful presentation! With the aid of this infographic I needed very little time to explain our process, and thus I focused on the issues I cared about most. My colleagues were pleased to have their own copy of my journey map, and even planned to copy the process for their own teams.
Change was slow in coming, but plans were set for PDs to hand off the content creation and management to others. This would give us the time that we needed to implement universal design practices in our products that would benefit the disabled students whom we served.